As the saying goes, numbers speak louder than words. That is why, to keep reflecting on // foss.events, in this blog post we’d like to share a few figures and statistics with you.
- The oldest entry dates back to February 3, 2019 – FOSDEM.
- The smallest event featured on // foss.events is probably our very own hackathon, with 2 participants, while the largest—unsurprisingly—is FOSDEM, which meanwhile draws around 8,000 participants.
- As of today, there are over 1,077 entries on // foss.events.
- 2025 is the best-documented year, with 193 entries.
- In total, there are events across more than 30 countries and over 290 different cities.
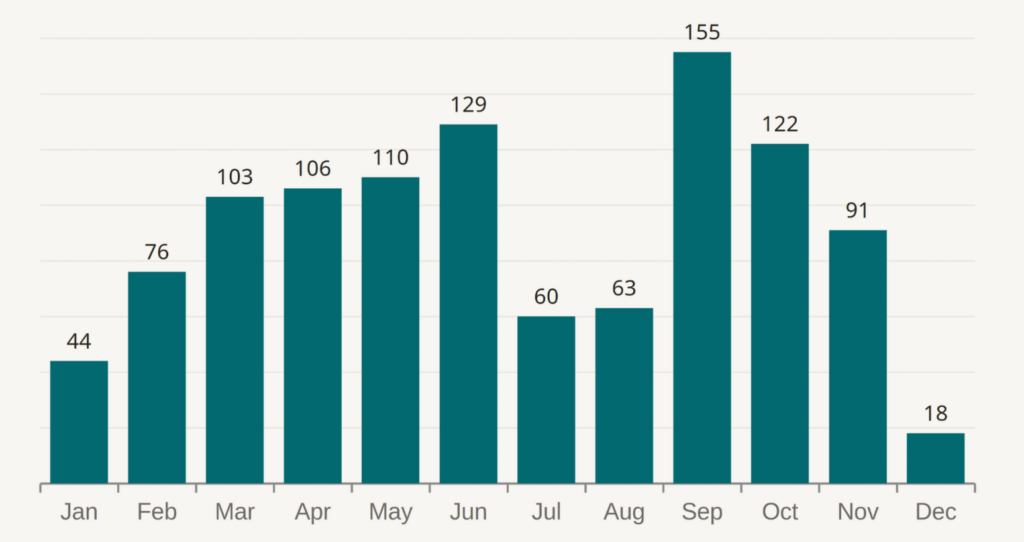
- 67% of all events occur during the spring (March to June) and autumn (September to October).
- 27% of all events take place in Germany, followed by Belgium, Spain, and France.
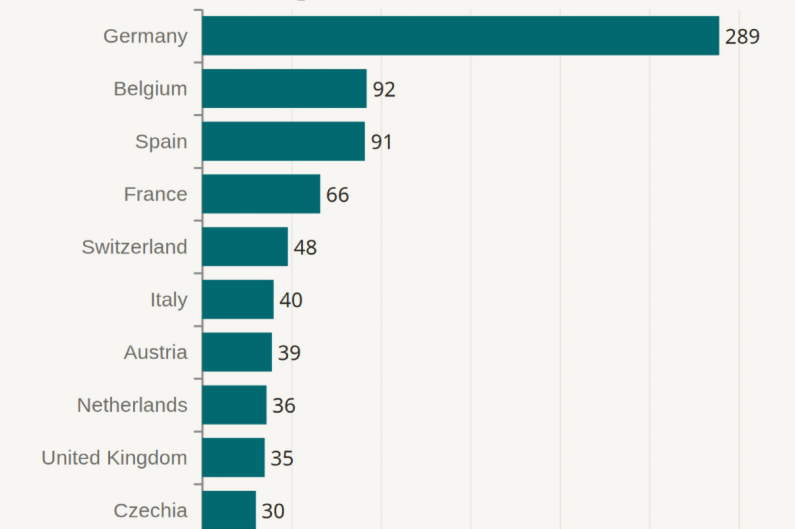
- Ireland, the UK, and Scandinavia are significantly underrepresented on // foss.events; we also have relatively few events in Eastern Europe, though that region is seeing growth.
- Our Mastodon account has more than 3.100 followers.
- We run an Umami instance that counts anonymous usage traffic. While these figures aren’t definitive, the data strongly suggests that annual unique visitor numbers are several tens of thousands.